
The Problem
Imagine a storekeeper who keeps a record of all his customers’ purchase histories. This allows him to look up the type of products an individual buyer might be interested in. However, doing this for each individual is grossly inefficient. A better solution would be to categorize his customers into groups, with each group having similar preferences. This would allow him to reach out to more customers with each product recommendation.
The problem is, the storekeeper does not know 1) how his customers should be categorized, nor 2) how many of such categories exist. To answer these questions, we can use clustering.
Definition
k-means clustering is a technique used to uncover categories. In the retail sector, it can be used to categorize both products and customers. k represents the number of categories identified, with each category’s average (mean) characteristics being appreciably different from that of other categories.
An Illustration
In the storekeeper’s case, we can uncover categories of customers by combining personal information with purchase histories. This would allow us to group customers of similar backgrounds, who tend to buy similar products.
To illustrate this, we use an actual dataset of Facebook user personalities and ‘likes’. This data was obtained from Facebook users who completed a short personality questionnaire and provided information on which movie pages they had ‘liked’. In place of personality scores, we may also use demographic information such as age or household income.
Based on experience, we may have a hunch that different movie genres appeal to people of different personalities. To confirm this, we can construct a plot of movie titles along personality dimensions:

The personality profile of each movie’s audience was estimated with the personality trait scores of Facebook users who had liked it. The horizontal axis is a combination of traits anxiousness and openness to experiences. The vertical axis is a combination of traits conscientiousness and extraversion.
From initial inspection, there appears to be three clusters:
- Red: Conscientious extraverts who like action and romance genres
- Blue: Anxious and open people who like avant-garde and fantasy genres
- Yellow: Introverts with social anxieties who like Japanese animations (otaku culture)
- Movies in the center seem to be general household favorites.
With this information, the storekeeper can now be more certain of recommending products to interested customers. For instance, if a customer bought a DVD of 27 Dresses, the storekeeper could deduce that his customer is likely to be conscientious or extraverted, and might also be interested in another movie in the same cluster, such as 50 First Dates. Besides product recommendation, such clusters also allow the storekeeper to bundle similar products for effective discounts.
Technical Explanation
After seeing how clusters can be used, we will now examine how the technique works. Recall that clustering solves two problems:
- Determining the number of categories that exist
- Determining the members of each category
One way to find out the number of categories is by visual inspection, as with the above plot of movie titles.
Another way is to use something called a scree plot:
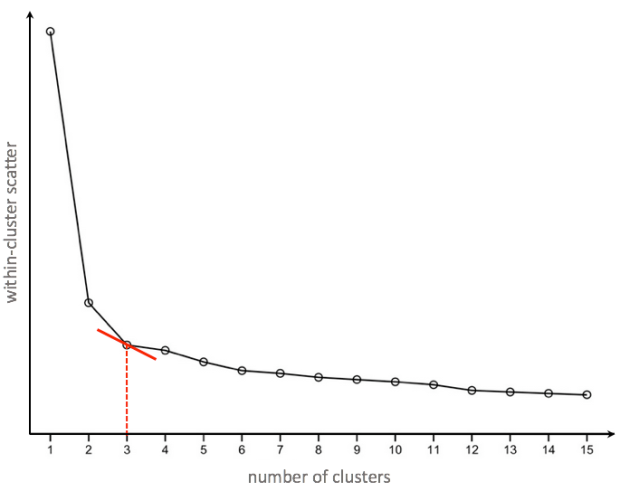
Scree plot showing a ‘kink’ where the number of clusters equals to 3
This plot shows how within-cluster scatter (i.e. how dispersed a cluster is) decreases as the number of clusters increase. With more clusters, cluster members can be closer to cluster centers, forming more compact clusters. Conversely, if there is only one cluster to which all members belong to, within-cluster scatter would be at its maximum.
The choice of number of clusters is based on the principle of diminishing marginal returns. If there are too many small clusters, the result may be overly-complex, such that categories are not generalizable to new products or customers. Hence, the scree plot reveals a “kink” at which the number of clusters derived can reduce within-cluster scatter to a reasonable degree, beyond which having any more clusters would yield smaller and yet smaller clusters. These smaller clusters come at an increasing cost of results being more complex and less generalizable.
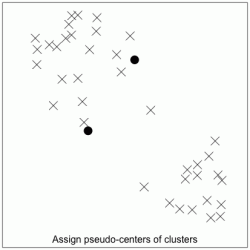
After determining the number of clusters, we can then determine cluster membership. This involves a simple iterative process. We will illustrate this process with a 2-cluster example:
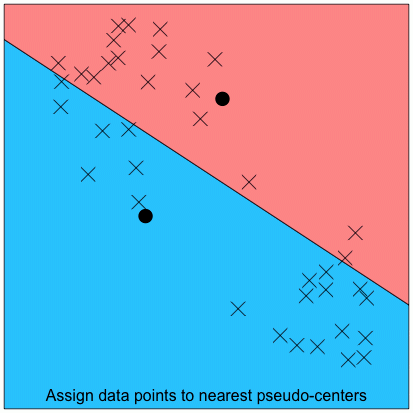
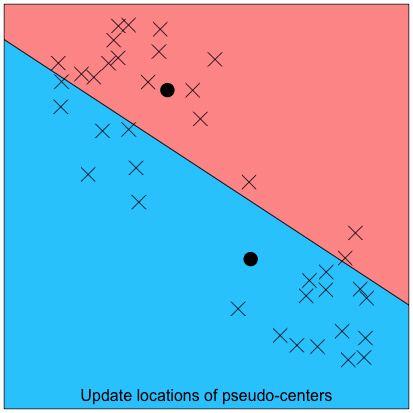
Step 4: Repeat the steps of re-assigning cluster members (Step 2) and re-locating cluster centers (Step 3), until there are no more changes to cluster membership. See the full iterative process in the animation below:

Animation of iterative process to derive clusters
These 4 steps wrap up the process of determining cluster membership. The same process is used for 3 or more clusters. In addition, while the above example only shows data points varying along 2 dimensions (as 2-dimensional plots are easier to visualize), clustering can also be done for 3 or more dimensions. In other words, the storekeeper could cluster his customers by combining multiple sources of information in addition to their personality, such as their age, income and how far their home is from his store.
Apart from the retail sector, clustering is used in a wide range of fields. For example, clustering can help to identify biological genotypes, and to pinpoint hot spots of criminal activity.
Limitations
While k-means clustering is a useful tool, it is not without limitations:
- Each data point can only be assigned to one cluster. Sometimes a data point might be in the middle of 2 clusters, having an equal chance of being assigned to either, but then a small shift might superfluously nudge it over to one of them. Hence, a more robust solution might include probability values, indicating how likely each data point might belong to each cluster.
- Clusters are assumed to be spherical. The distance from a cluster center to its furthest data point is akin to the cluster’s radius, and the iterative process of finding data points closest to the cluster center is akin to narrowing the cluster’s radius, so that resulting clusters are compact spheres. This might pose a problem if the shape of an actual cluster is, for instance, an ellipse. An elongated cluster might be truncated, and its members subsumed into a nearby cluster.
- Clusters are assumed to be discrete. k-means clustering does not permit clusters to overlap, nor to be nested within each other.
While there are alternative clustering algorithms that overcome these limitations, the strength of k-means clustering algorithm lies in its elegant simplicity. A good strategy might be to start with k-means clustering to get a basic understanding of the data structure, before diving into more advanced methods to examine areas where k-means clustering falls short.
R script used to simulate iterative process downloadable here.
Did you learn something useful today? We would be glad to inform you when we have new tutorials, so that your learning continues!
Sign up below to get bite-sized tutorials delivered to your inbox:

Copyright © 2015-Present Algobeans.com. All rights reserved. Be a cool bean.

First of all thanks for the clear and “simple” explanations about k-means.
@annalyn NG, im testing the R script but it does not seem to work. The dummy calculations goes wrong.
> dummy = deldir(0,0, rw=c(0,1,0,1))
Error in `$<-.data.frame`(`*tmp*`, "ind1", value = integer(0)) :
replacement has 0 rows, data has 1
How can i get this to work,
LikeLike
Hi Sander, is the R engine and deldir package up-to-date? Did you modify any other part of the code?
LikeLike
Hi Annalyn,
Here some version info.
> version
_
platform x86_64-w64-mingw32
arch x86_64
os mingw32
system x86_64, mingw32
status
major 3
minor 3.2
year 2016
month 10
day 31
svn rev 71607
language R
version.string R version 3.3.2 (2016-10-31)
nickname Sincere Pumpkin Patch
> packageDescription(“deldir”)
Package: deldir
Version: 0.1-12
Date: 2016-06-03
Title: Delaunay Triangulation and Dirichlet (Voronoi) Tessellation
Author: Rolf Turner
Maintainer: Rolf Turner
Depends: R (>= 0.99)
Suggests: polyclip
Imports: graphics, grDevices
Description: Calculates the Delaunay triangulation and the Dirichlet or Voronoi tessellation (with respect to the entire plane) of
a planar point set. Plots triangulations and tessellations in various ways. Clips tessellations to sub-windows.
Calculates perimeters of tessellations.
License: GPL (>= 2)
NeedsCompilation: yes
Packaged: 2016-03-06 03:33:51 UTC; rolf
Repository: CRAN
Date/Publication: 2016-03-06 09:37:13
Built: R 3.3.3; x86_64-w64-mingw32; 2017-03-23 02:18:36 UTC; windows
Nope i did not change any other part of the code.
LikeLike
Thanks Sander. Try replacing the line with this instead:
dummy = deldir(xpc,ypc, dpl=list(ndx=1,ndy=0), rw=c(0,1,0,1))
LikeLike
Works like a charm! thanks!
LikeLiked by 1 person
Wonderful explanation. I especially appreciate that you included “limitations” for consideration as well. Subscribing now.
LikeLike
Hi Mrinal, thank you for your feedback! Glad you like our explanations 🙂
LikeLike