
Is it possible to beat lottery? In this post, we conduct data analysis of Toto, a Singapore lottery with twice-weekly draws. We look at how not all bets are equal, and how betting in a certain manner can provide greater payoffs.
The Problem
In Toto, a S$1 bet allows the buyer to pick 6 numbers from 1 to 49. During the lottery draw, six main numbers plus an additional number are drawn. Matching the six main numbers wins the jackpot, which starts at S$1 million. In addition, matching three or more winning numbers on a ticket qualifies the buyer for a prize, which escalates with more numbers matched.
The biggest draw of the year occurs during Lunar New Year, and for the 2022 Lunar New Year draw it is expected that over S$60 million worth of bets will be placed, for a jackpot prize of around S$16 million. Table 1 below summarizes the prize groups and their respective odds.
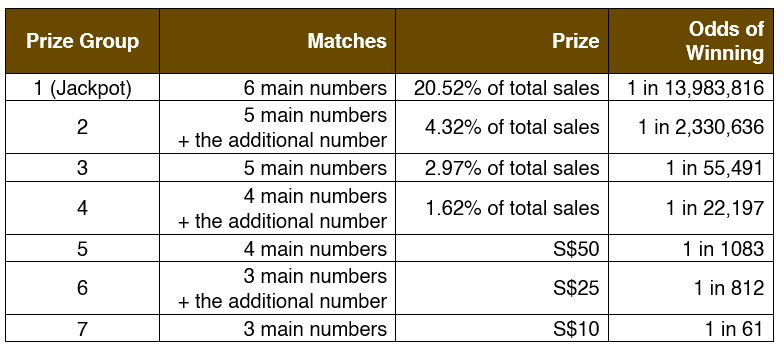
Note that for an ordinary S$1 bet, you can claim only one prize (e.g. if you claim the Group 1 prize, you cannot claim the Group 2 to 7 prizes). In addition, the prizes for Prize Groups 1 to 4 are split equally among all winners within their respective group (e.g. if S$10 million worth of bets were bought, then the Group 4 prize is 1.62% x S$10m = S$162,000. If there were 162 winners in Group 4, each winner would receive S$1,000).
For this analysis, we used data on past Toto winning numbers, winning amounts, and prize amounts, which is available on the Singapore Pools website. Given that there was a change in Toto’s rules on Oct 7, 2014, from a “6 out of 45” format to “6 out of 49” format (with also changes to various group prizes), we limited our analysis to the 742 Toto draws from Oct 7, 2014 to Feb 3, 2022.
Observation 1: All numbers have an equal chance of being drawn
Given that 742 draws of 7 numbers were made, we expect that each of the 49 numbers will be drawn around 106 times. Due to the randomness of the draws, some variance is expected, and some numbers will be drawn more than 106 times while others less. From Figure 2, we observe that number 45 was drawn the least (76 times), while number 40 was drawn the most (125 times).
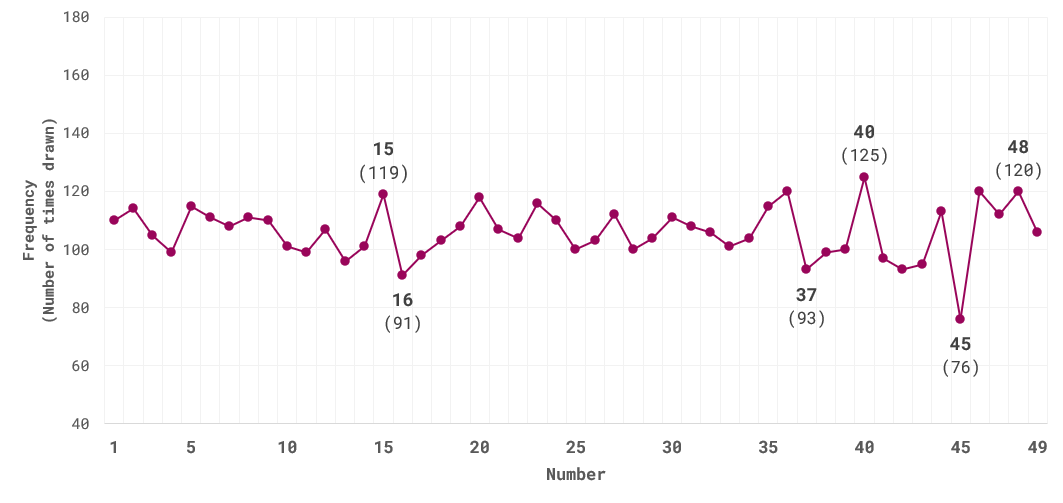
This means that the number 40 was drawn over 1.5x more often than number 45. Is this disparity due to pure randomness? Or could there be some anomaly in the draw system? Using a statistical test called the Chi-squared test for goodness-of-fit, we can test whether the frequency of drawn numbers differs significantly from their theoretical frequency (i.e. 106 times each). In this case, we can conclude that the disparity is not significant, and can safely say that all numbers have an equal chance of being drawn.
Observation 2: An ordinary Toto lottery ticket gives you an average return of S$0.42 per S$1 bet
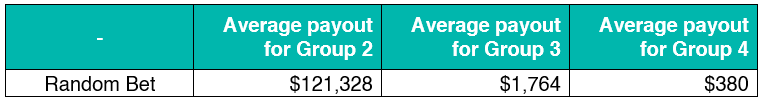
In Table 3, we list the probability of an ordinary Toto lottery ticket (6 numbers) winning the 7 prizes, and the average payout for the Group 1 to 4 prizes (excluding special events such as Snowball / Cascade, explained later under Observation 5). Multiplying the probability with the average payout gives us the average return.

In most gambles, the average return of a S$1 bet will be less than S$1, and the difference is kept by the lottery operator as revenue. Thus, if we can develop a betting strategy that allows us to obtain an average return of more than S$1, we can potentially beat the Toto lottery.
Observation 3: Some numbers are bought more frequently than others
In Chinese culture, the number 8 is believed to be the luckiest number and is associated with wealth. With the Chinese ethnicity comprising the population majority, would 8 be the number that Singaporeans pick the most? By analyzing the ratios between Group 6 and Group 7 winners, we can derive the frequency in which each number was bought:
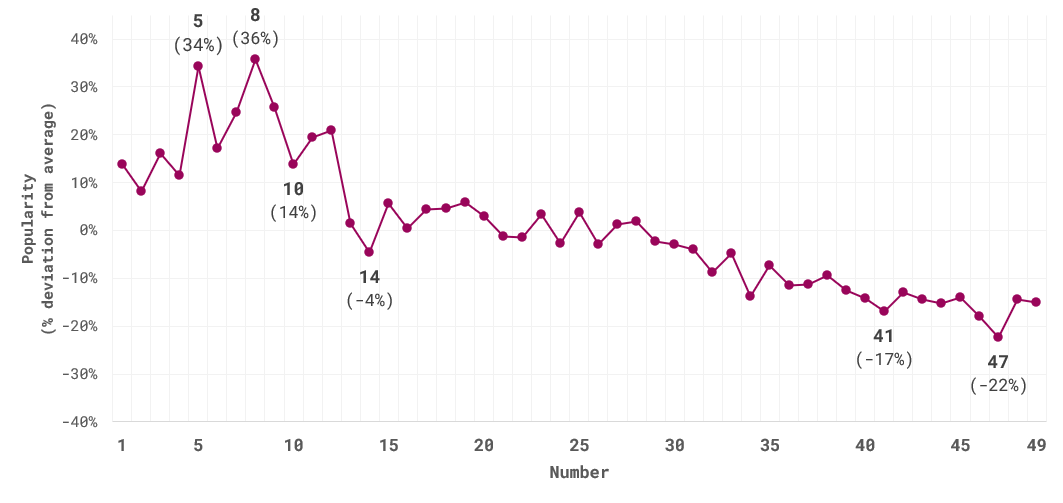
From Figure 4, we can see that the number 8 is picked the most, at 36% more frequently than average. Conversely, the number 47 is picked the least, at 22% less frequently than average. It is not surprising to see that small numbers (e.g. 1 to 10) are picked more frequently, given that lottery buyers often pick numbers based on associated numbers or events in real life (e.g. birthdays, apartment floor), which are more likely to be smaller numbers.
Technical Explanation – How did we derive the frequency of bought numbers in Figure 4? Recall in Table 1 that both Group 6 & Group 7 winners must have matched 3 main numbers. Mathematically, the ratio of Group 6 winners to Group 7 winners should be 3:40. This is as, assuming only 3 of your 6 chosen numbers matched the main winning numbers, you have 3 remaining numbers left that did not match the main winning numbers. Moreover, there are 43 remaining numbers outside of the 6 main winning numbers that could be the additional number. Thus, the probability of matching the additional number is 3 /43, and the probability of not matching is 40 / 43, hence giving the ratio of 3:40. As such, if all numbers were bought at the same frequency, the ratio between Group 6 winners (i.e. matched 3 main numbers and 1 additional number) and Group 7 winners (i.e. matched 3 main numbers and 0 additional number) is 3:40. However, this ratio increases when the additional number is more frequently bought among lottery buyers, given that tickets that matched 3 main numbers are more likely to match the additional number. For example, when 8 was the additional number, on average there were 4.069 Group 6 winners for every 40 Group 7 winners, i.e. a 4.069:40 ratio. This meant that the number 8 was picked 36% more frequently than average. |
Observation 4: Some numbers are associated with higher payouts
If you put Observation 1 & 3 together, combined with the fact that prizes for Groups 1 to 4 are split equally among winners, it is easy to understand why different winning numbers have different payouts. This is because when winning numbers are numbers that buyers pick more frequently, there will be more winners to split the prizes, and thus less payout for each winner. Conversely, if winning numbers are unpopular numbers, the payout should increase. What, then, is the difference in payout?
In Tables 5 and 6, we illustrate the average payouts of Groups 2 to 4, when more small numbers (1 to 15) were drawn as winning numbers, vs. when more large numbers (34 to 49) were drawn.
Recall in Table 3 that the average payouts for Groups 2 to 4 were:
Then,
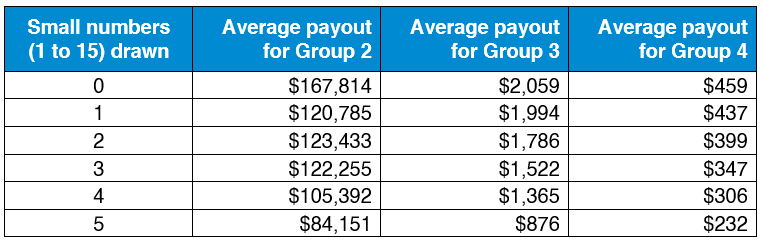
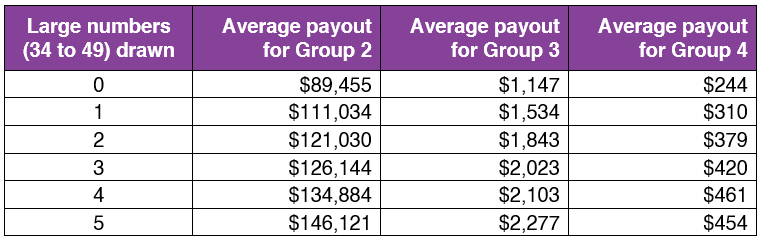
The decrease in average payouts is staggering when more small numbers are drawn compared to when more large numbers are drawn; when your selection of numbers includes 5 to 6 small numbers, expect your payout to decrease by 40% compared to a random bet.
Conversely, when your selection of numbers includes 5 to 6 large numbers, expect your payout to increase by 20% compared to a random bet. To maximize expected winnings, you may consider selecting numbers that are picked less frequently by other buyers, e.g. large numbers 34 to 49.
.
Observation 5: Buying Toto during special events can increase your average payout
Let’s examine two types of special events: (a) the annual Lunar New Year draw, which guarantees a minimum jackpot amount of S$12,000,000; and (b) draws with Snowball / Cascade.
(a) Annual Lunar New Year Draws
One might wonder whether the expected payout of this draw will be 12 times that of an ordinary draw, given that the jackpot amount is S$12,000,000, which is 12 times more than the usual jackpot amount of S$1,000,000.
That would be the case, if the number of bets placed for this draw remains the same. However, based on past years’ draws, it is expected that the number of bets placed will be at least 12 times more than usual. From the long snaking queues seen at betting outlets, we may expect this year to be no different. As such, while the prize money has increased, we may also expect to see more winners in each group, leading to the expected payout being similar to regular draws. In fact, the expected payout for a S$1 bet in the Lunar New Year draw will be close to S$0.54 since the lottery operator keeps 46% of all stakes as revenue.
(b) Snowball / Cascade Draws
In Toto, the jackpot prize is snowballed into the next draw when there are no jackpot winners during the current draw. This can happen a maximum of 3 times. On average, there are 8 draws a year where the jackpot has snowballed 3 times.
If there are still no jackpot winners in the 3rd snowball draw, then the entire snowballed amount is cascaded to Group 2, to be shared equally among all Group 2 winners of that draw. Based on probability, this will happen on around 20-25% of 3rd snowball draws.
Buying when the jackpot has snowballed increases your average payout significantly, because a portion of the previous draws’ prize monies (which no one won) would be added to the current draw. In Table 7, we looked at past data on Snowball draws.
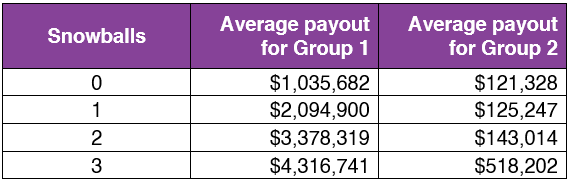
We can see that as the number of snowballs increases, the average payout for Groups 1 and 2 increases too. There is also a significant increase in the average Group 2 payout after 3 snowballs, due to the possibility of the grand prize cascading to Group 2. As such, to maximize expected winnings, you may consider buying only during 3rd snowball draws.
.
Putting it all together: Can we beat the Toto lottery?
Can we beat the Toto lottery by adopting these 2 strategies: (a) Buying more large numbers (34 to 49); and (b) Buying only during 3rd snowball draws?
As it turns out, no, but we come close.
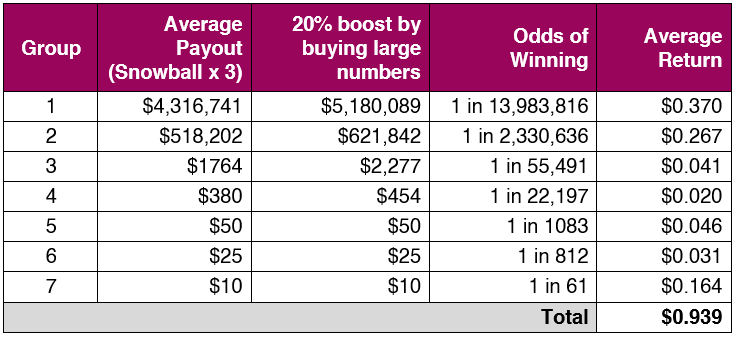
By adopting these 2 strategies, the average return grows from S$0.416 to S$0.939. This means that if we play this lottery an infinite number of times, we can expect to receive S$0.939 for every S$1 we bet. Interestingly, if a 4th snowball is allowed, the average return will probably grow to beyond S$1, and this is perhaps why jackpot prizes can be snowballed a maximum of 3 times and not more.
Limitations
Firstly, despite having a strategy that gives a high theoretical average return, your actual average returns may not be close to the theoretical average return. This is because the chances of winning a Group 1 or 2 prize is extremely low, and yet in the theoretical average return of S$0.939, the Group 1 and 2 components add up to S$0.637. This means that if you have never won Group 1 and 2, your actual average return may be as low as S$0.302. Ultimately, the Toto lottery is still a game of luck.
Secondly, the 20% boost for buying large numbers (see Observation 4) is dependent on these numbers continuing to be less frequently bought by other people. If the entire Singapore reads this post and starts buying more large numbers, the advantage may well disappear.
We wish our readers a happy Lunar New Year, and would like to remind everyone to gamble responsibly.

Afterall, that would work provided that the six most unpopular numbers provides a 6% boost to the winnings as compared to the strategy of buying larger numbers of above 35.
LikeLike
Instead of buying only large number, what if we plugged in the six most unpopular numbers into the model? What is the expected return if we adjusted the mode to only buy the six most unpopular numbers during the third snowball draw?
LikeLike